1.3. Using Keras to Implement Multi-Layer Perceptron (Artificial Neural Network) Hands-On (Basics)
This article continues from the previous article, 1.2. Multi-Layer Perceptron (Artificial Neural Network) Nonlinear Classification Theory; please read that one first.
1.3.1. Keras
Keras is an application programming interface written in Python for neural network development. By using this API, you can develop neural networks, convolutional neural networks, recurrent neural networks, and other common deep learning algorithms.
Features:
- It integrates many mature deep learning algorithms, is easy to install and use, comes with abundant examples, and has very detailed tutorials and documentation
- It can run with TensorFlow or Theano as its backend
I have attached the official website here.
1.3.2. Relationship Between Keras and TensorFlow
TensorFlow is an open-source software library that uses a data-flow graph and is used for numerical computation. It can automatically compute derivatives related to a model, which makes it very suitable for solving neural network models.
Keras can be seen as an interface encapsulated on top of TensorFlow (Keras as the front end, TensorFlow as the back end). Keras provides users with an easy-to-interact-with shell that makes rapid deep learning development convenient.
1.3.3. Install Keras and TensorFlow
Enter the following command in the terminal to download and install them:
pip install keras tensorflow
1.3.4. Preparation
This article uses my csv file. I uploaded it to GitHub, and you can click the link to view and download it.
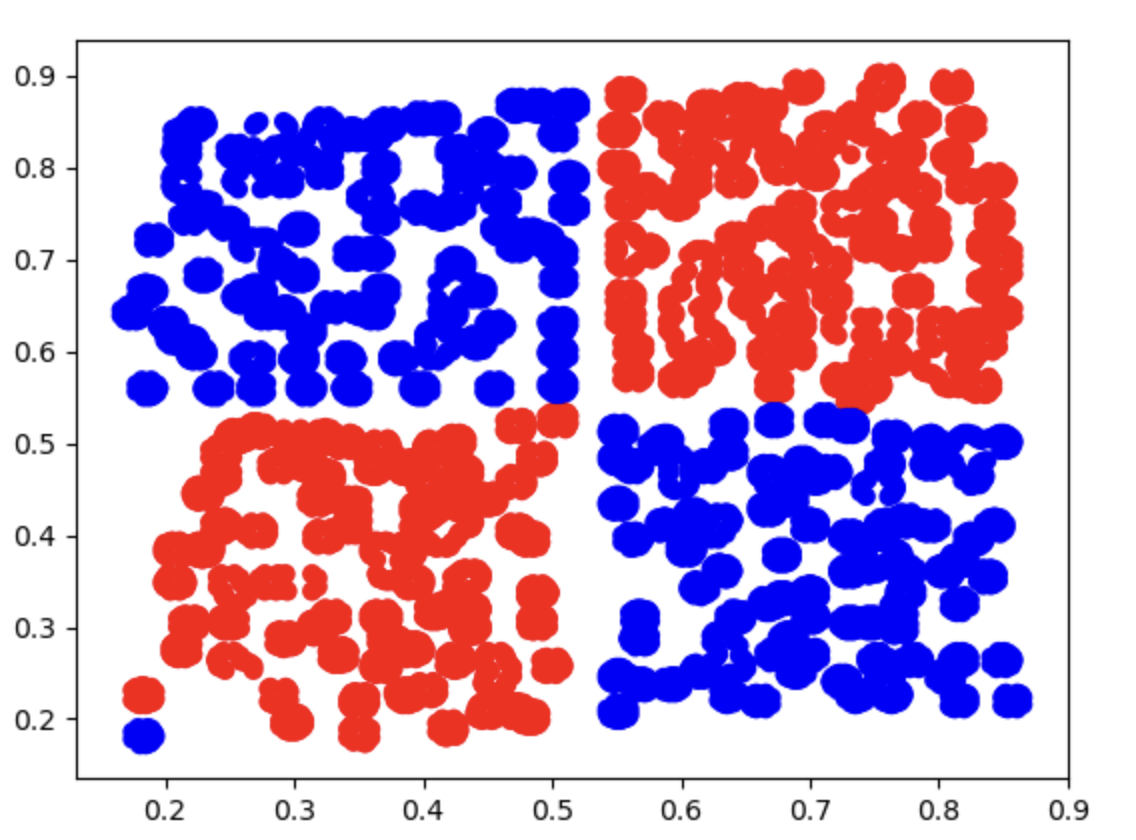
It has 3 columns of information: one column is x1, one column is x2, and these two columns represent the two input variables. The other column is label, and the values in this column are either 0 or 1.
After downloading it, just move it into your Python project folder.
1.3.5. Write the Code
Step 1: Load the Data
First, use the pandas library to read the data:
# Read the data
import pandas as pd
data = pd.read_csv('scatter_data.csv')
Visualize it with matplotlib:
# Visualize the raw data
# Draw the scatter plot
import matplotlib.pyplot as plt

scatter = plt.scatter(
    data['x1'],
    data['x2'],
    c = ['blue' if label == 0 else 'red' for label in data['label']],
)

plt.show()
Image output:
Step 2: Assign Values to x and y
- The value of
xcorresponds to the two input valuesx1andx2 - The value of
ycorresponds to the labellabel
# Assign values to x and y
x = data.drop(['label'], axis=1)
y = data.loc[:,'label']
We also need to split the data into training and test sets for later model evaluation:
# Split into training and test sets
from sklearn.model_selection import train_test_split
x_train, x_test, y_train, y_test = train_test_split(x, y, test_size=0.3, random_state=10)
Step 3: Create the Model
We need to create an MLP with three layers to solve the problem, and each neuron uses the logistic function. Its rough structure should look like this flowchart:
graph TD;
    %% Input Layer
    A[1] -->| 5 | B[a₁²]
    A[1] -->| -20 | C[a₂²]
    X1[x₁] -->| -10 | B[a₁²]
    X1[x₁] -->| 15 | C[a₂²]
    X2[x₂] -->| -10 | B[a₁²]
    X2[x₂] -->| 15 | C[a₂²]

    %% Hidden Layer to Output Layer
    B[a₁²] -->| 15 | Y[y]
    C[a₂²] -->| 15 | Y[y]
    Bias2[1] -->| -10 | Y[y]
# Build a Sequential model
from keras.models import Sequential
model = Sequential()

# Stack layers with add
from keras.layers import Dense
model.add(Dense(units=20, activation='sigmoid', input_dim=2)) # From the first layer (input layer) to the second layer (hidden layer)
model.add(Dense(units=1, activation='sigmoid')) # From the second layer (hidden layer) to the third layer (output layer)

# View the model structure
model.summary()

# Configure model-solving parameters with .compile()
model.compile(loss='binary_crossentropy', optimizer='adam', metrics=['accuracy'])
-
Sequentialis a basic model type in Keras used to stack network layers one after another, with each layer connected in creation order. This approach is ideal for building neural networks that follow a single path from input to output, such as classic feedforward neural networks -
The first
addadds aDenselayer (a hidden layer):- Fully connected layer, where each neuron is connected to every neuron in the previous layer
units=20: indicates that the hidden layer contains 20 neuronsactivation='sigmoid': uses the logistic function as the activation function, which maps input values into the range (0, 1) and is suitable for binary classification or probability outputsinput_dim=2: indicates that the input feature dimension is 2 (x1andx2), which is the input shape of the first layer
-
The second
addadds the output layer:units=1: indicates that this layer has only one neuron, i.e. the output dimension is 1activation='sigmoid': in the output layer, sigmoid is commonly used as the activation function for binary classification problems, producing values between 0 and 1 that represent the probability of belonging to a certain class
-
model.summary(): prints detailed structural information about the neural network model, including each layer’s name, output shape, and parameter count. This is an important method for debugging and understanding the model, and it helps confirm that the model you built matches your intended design -
.compile()defines the training configuration of the model, including the loss function, optimizer, and evaluation metrics:loss='binary_crossentropy': the loss function. Choose the appropriate loss based on the task.binary_crossentropyis generally used for binary classificationoptimizer='adam': the optimizer, here Adam (Adaptive Moment Estimation)metrics=['accuracy']: the evaluation metric; here accuracy is selected as the evaluation criterion
Output:
Model: "sequential"
┏━━━━━━━━━━━━━━━━━━━━━━━━━━━━━━━━━┳━━━━━━━━━━━━━━━━━━━━━━━━┳━━━━━━━━━━━━━━━┓
┃ Layer (type)                    ┃ Output Shape           ┃       Param # ┃
┡━━━━━━━━━━━━━━━━━━━━━━━━━━━━━━━━━╇━━━━━━━━━━━━━━━━━━━━━━━━╇━━━━━━━━━━━━━━━┩
│ dense (Dense)                   │ (None, 20)             │            60 │
├─────────────────────────────────┼────────────────────────┼───────────────┤
│ dense_1 (Dense)                 │ (None, 1)              │            21 │
└─────────────────────────────────┴────────────────────────┴───────────────┘
 Total params: 81 (324.00 B)
 Trainable params: 81 (324.00 B)
 Non-trainable params: 0 (0.00 B)
Step 4: Train the Model
We just need to feed the data into the model and let it iterate:
model.fit(x_train, y_train, epochs=3000)
- The
epochsparameter controls the number of iterations
Step 5: Predict the Data
We use the x values in the test set to predict the y values and compare them with the actual y values to generate accuracy:
# Predicted values
y_predict = model.predict(x_test)

# Convert probability values into discrete class labels
y_predict_classes = (y_predict > 0.5).astype(int)

# Calculate accuracy
from sklearn.metrics import accuracy_score

print(accuracy_score(y_test, y_predict_classes))
Output:
0.9977413890457368
If we keep iterating, the accuracy will be even higher, but it may cause overfitting, which would not be worth it.